Tag Archives: Burlington

Stuck in the middle

Couple with daughter together in front yard
 

Middle-class financial struggles have occupied the public discourse for some time, but wouldn’t you know, we’re starting to hear more about housing unaffordability as a stresser for this beleaguered population segment.

The annual “State of the Nation’s Housing” report from Harvard took note this summer:

While long a condition of low-income households, cost burdens are spreading rapidly among moderate-income households. The cost-burdened share of renters with incomes in the $30,000–45,000 range rose 7 percentage points between 2003 and 2013, to 45 percent. The increase for renters earn­ing $45,000–75,000 was almost as large at 6 percentage points, affecting one in five of these households. On average, in the ten highest-cost metros—including Boston, Los Angeles, New York, and San Francisco—three-quarters of renters earning $30,000–45,000 and just under half of those earning $45,000–75,000 had disproportionately high housing costs.”

Granted, much of the news about middle-class housing unaffordability is coming out of the big cities – places where “middle income” is construed to reach far above Vermont standards. For example, Cambridge, Mass., is taking steps to reserve a share of “affordable” housing in a new Kendall Square building for families with incomes in the low six figures! San Francisco is also considering measures that would expand affordable housing eligibility and help out renters in the $100,000 to $140,000 bracket. And Portland, Ore., where the “housing emergency” is apparently wide-ranging, is looking at a form of inclusionary zoning that make apartments available to people making 100 120 percent of the median income (Up to $96,875 for a family of four).

Perhaps it’s a testament to the severity of the housing crisis around the country, and/or to the fragility of the middle-income stratum, that the terms “middle class” and “subsidy” are suddenly being spoken in the same breath.

middle2

Here’s the thing: To qualify for most subsidized housing, applicants can’t earn more than 80 percent of the local median income. Where does that leave people who draw an average salary, or perhaps a little more? Perhaps in a place where they can’t readily afford housing but can’t get any help, either. How many such people there are in Vermont is unclear; plenty, no doubt.

(Note: Middle-income earners are not beneficiaries of Burlington’s inclusionary zoning ordinance, which aims to provide affordable rentals for people earning up to 65 percent of the median; and for sale, up to 75 percent.)

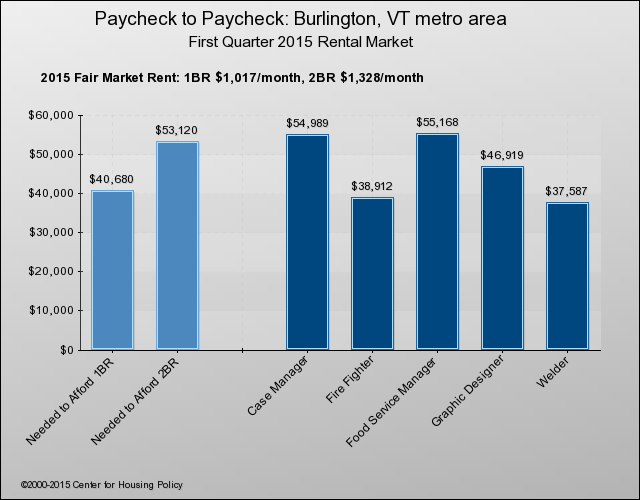
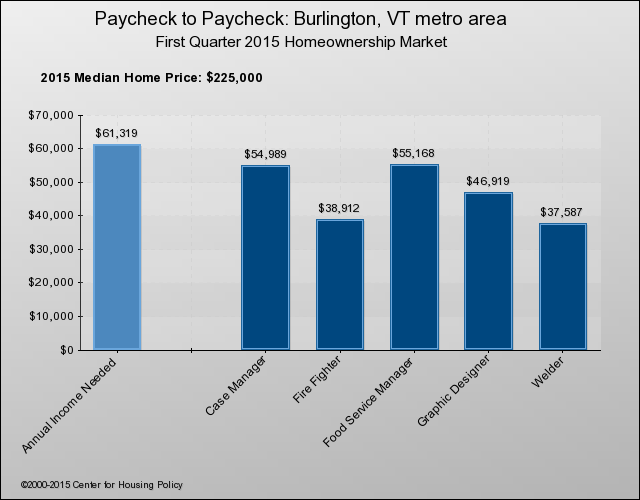
For an illustrative display of how housing costs compare to standard incomes, the National Housing Conference’s interactive “Paycheck to Paycheck” shows bar graphs for each of the nation’s metro areas – and just one in Vermont, Burlington/South Burlington. One graph compares salaries to the pay needed to afford a median-priced home; another does the same thing for 1- and 2-BR apartments at HUD’s “fair market rent.”

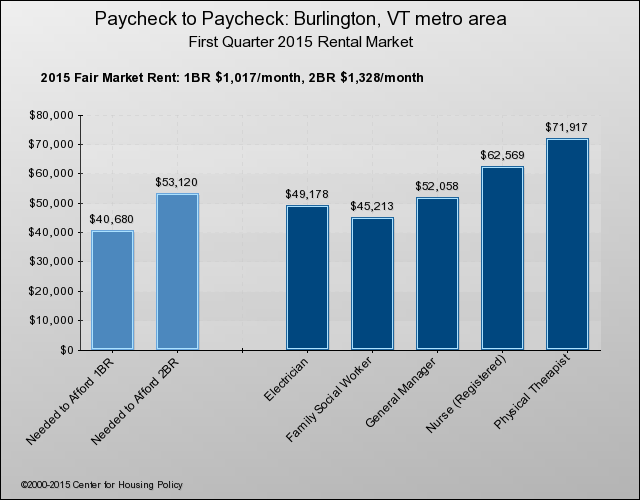
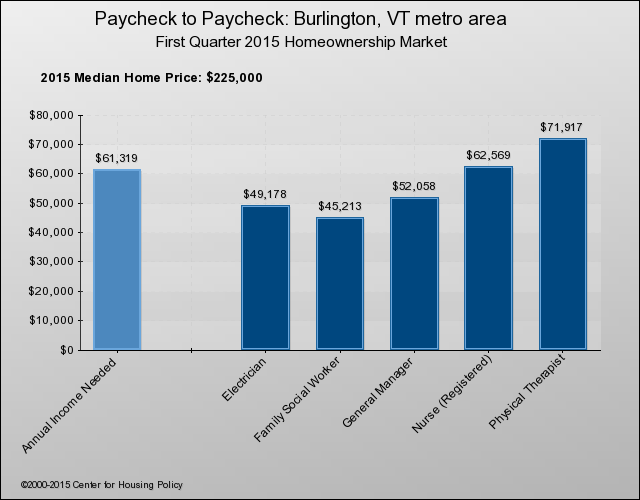
Below are the charts for 10 occupations that might be considered to be middle class. As you can see, eight of the 10 would be hard pressed to afford purchase of an average home in Burlington:

paycheck3


paycheck5


They do a little better in the rental market, but still, six of 10 can’t comfortably afford a two-bedroom apartment in Burlington:

paycheck4


paycheck6


We’re full, so go somewhere else

density1When someone says that a town or a city is “built out,” what does that mean? It often means simply that the speaker doesn’t want any more people moving in – even though it might be possible to design more space, in keeping with local standards, that would accommodate more people.

The common claim that a city has run out of room reflects not a physical reality, but rather, an exclusionary prejudice, as Emily Badger suggests in a thought-provoking piece in the Washington Post. She points to widely varying population densities of major “First World” cities (Seattle, 3,000 people per square mile; New York, 4,500; Paris, 9,500; London, 14,600). How can anyone in San Francisco, even with its topographical challenges, argue that that city is “built out” at a mere 5,400 people per square mile? In fact, according a Berkeley economist, the city could accommodate 30-40 percent more people without losing its character.

Building higher and shrinking parking lots can seem reasonable as planning options, but there are limits. In Burlington (2,730 people per square mile), for example, any building higher than about 12 stories would likely be seen as excessive, and no one is ready to enforce a dramatic reduction in vehicles plying the city’s roads. There is such a thing as overcrowding, too (HUD’s so-called Keating memo calls for a limit of two people per bedroom), but of course most American communities are nowhere near their limit.

The most densely populated municipality in Vermont is undoubtedly Winooski , about 4,800 people per square mile.

winooski

And Winooski, when you meander through it, doesn’t come across as particularly dense – much of its 1.5 square miles is occupied by single-family lots, after all. It could get denser and still be less so than LA (6,000 people per square mile) or Madrid (12,100) – never mind Mexico City (25,100) or Jakarta (24,500).

Nationally, exclusionary land-use practices have had the effect of holding down housing supply and pushing up housing prices. Consider California, where housing prices began to soar above those in the rest of the country starting around 1970. One reason California diverged, according to an legislative analysis that came out earlier this year, is housing construction has been limited – by community resistance, environmental policies and other factors – in coastal urban areas. That has driven up prices there and inland as well.

The legislative analyst called for policy changes that would lead to significantly more housing along the coast. Here again, the suggested remedy for unaffordability was a familiar one: increase the housing supply. But does anyone believe that can be left simply to market forces?

Moreover, merely eliminating exclusionary policies and increasing density, while favoring more affordability, aren’t necessarily sufficient to promote inclusiveness, or integration. The pro-density strategy has to be combined with affirmatively fair housing, as Jamaal Green argues in this Shelterforce article.


Taller & brighter

Once upon a time, believe it or not, planners of public housing in the United States believed high rises were a good thing. In the early ‘40s, we learn from J.A. Stoloff’s history of public housing, the thought high-rises “could provide a healthy, unique living environment that would contrast favorably with surrounding slum areas.”

Well, as we all know, high-rises for families didn’t work too well in the big metro areas. Two notorious examples in Chicago were Cabrini Green …

cabrinigreen


and Robert Taylor Homes…


KONICA MINOLTA DIGITAL CAMERA


drab, unsightly, unlivable in many ways, they unfortunately tainted the popular conception of public housing. No public-housing high-rises were built after the early ‘70s, and by the ‘90s many of these buildings were being torn down.

As it turned out, though, some public-housing high-rises did work pretty well – for elderly residents. One such example, built in 1971, is the tallest building in Vermont – 11-story Decker Towers in Burlington, operated by the Burlington Housing Authority for elderly and disabled residents:

decker


Granted, construction of ANY public housing is passe in this country, sadly, but before you stop thinking about high-rises, look at some examples in Singapore, where public-housing high-rises are home to a majority of the population. These shots are by Peter Steinhauer, a photographer:

sing1


These photos make two things really clear: (1) High rises don’t have to be drab and dreary…sing3


sing2


… and (2) no one should have any trouble finding the street address of these places.


The bright colors bring to mind some of the buildings in Burlington’s Old North End, many of them owned or developed by Stu McGowan …

stu2


Now that we’ve drawn your attention back to Vermont, let’s consider building height on a Vermont scale as we also consider how to add to the state’s affordable housing stock. High rises are out of the question, of course, especially in our small towns. But what about adding a third story to buildings in town centers, here and there, for family apartments? Is that such an outrageous idea? This three-story building in the photo below doesn’t look a bit out of place.

stu1


So much for artists’ affordable housing

When Burlington’s mayor announced that he would not support housing in the South End’s Enterprise Zone, he won cheers from artists who feared gentrification. While the mayor’s isn’t necessarily the last word in “Plan BTV South End,” the product of extensive public input (or so the city proudly insists), it does stack the odds against any kind of housing in the zone.

Too bad. One of the more intriguing prospects raised in the draft plan was to create work/live spaces – aka, affordable housing – for artists. Could that be done deftly in some of those South End warehouses without gussying up the surrounding neighborhood and driving up rents for everyone else? Maybe, maybe not, but it seems a shame not to consider this. A blanket ban on housing seems to foreclose the possibility.

southend

Well, it’s a possibility that’s being embraced elsewhere, all around the country – in little towns and big cities, both. “Colorado’s affordable artist housing efforts catching on quickly,” read a headline in Saturday’s Denver Post. Artspace, out of Minneapolis, has been developing work/live artists’ lofts for more than 20 years – but apparently none yet in New England.

If Burlington’s artists aren’t interested, perhaps their counterparts in other warehouse-rich Vermont towns might be. Bellows Falls, Springfield, Rutland, Brattleboro, among many others? Here’s the view in Colorado, according to the Post article:

“The hope is that some rural projects will have the added advantage of preserving historic structures in need of attention. That makes Trinidad, with its excess of significant, and underused, buildings, a good candidate for the pilot program…”

Check out what’s been done in Fergus Falls, Minn. (pop. 13,300)…

fergus

or  Hastings, Minn. (22,400).

hastings

If you’re looking for an example of a dreary warehouse transformed, look at Council Bluffs, Iowa …

council bluffs

or even Memphis – which is fashioning an arts district around its project.

memphsis

Now, it may be that some of projects, the affordable housing notwithstanding, have contributed to surrounding gentrification. But if so, did it have to be that way? Municipal planners take note.


Burlington’s unaffordability update

Yesterday was the due date for Burlington’s CAPER – that is, the Consolidated Annual Performance & Evaluation Report that the city has to file with HUD every year as a condition of receiving Community Development Block Grant (CDBG) and HOME funds. (HOME is a federal program that supports the rehabilitation, acquisition and construction of rental housing.)

burlingtonapt

If you want to know more about the allocation of these funds, which amount to several million dollars, and about the beneficiaries, you can go to the report, which covers July 1, 2014 to June 30 , 2015. Here, we’re just going to refer to  three graphics that apply to housing.

The first two may look familiar to you. They’re in Appendix A, Pages 53 and 54. Rental vacancy rates in Chittenden County have been exceedingly low for at least two decades, as shown on the first graph, and still are. That’s one reason rents are as high as they are.

The vacancy rate here here is typically below 2 percent. That’s below  the “Balanced rate” of 4 percent supposedly the threshold for a healthy rental market, and its well below the rates for the Northeast and the U.S.

As for the housing wage – that is, the amount a person has to earn to be able to afford to rent an dwelling of average cost — well, no big surprises here, either. The graph on Page 25 shows four pillars, left to right, represent the costs of renting apartments: efficiency, one-bedroom, two-bedroom and three-bedroom. As you can see, a minimum-wage worker is out of luck, as is a median-wage worker who wants anything bigger than an efficiency.

By definition, you can “afford” an apartment if you spend no more than 30 percent of your income on housing. For context: According to the 2015 edition of “Out of Reach,” put out by the National Low Income Housing Coalition, Vermont’s two-bedroom-apartment housing wage is $20.68 an hour, and the average wage for renters is $11.78.

OK, so how did Burlington fare for the year in its affordable housing program? It came up short, as you can see in the following table:

CR-20 – Affordable Housing 91.520(b)

Evaluation of the jurisdiction’s progress in providing affordable housing, including the number and types of families served, the number of extremely low-income, low-income, moderate-income, and middle-income persons served.


  One-Year Goal Actual
Number of Homeless households to be provided affordable housing units  

15


0

Number of Non-Homeless households to be provided affordable housing units  

76


46

Number of Special-Needs households to be provided affordable housing units  

0


0

Total 91 46


  One-Year Goal Actual
Number of households supported through Rental Assistance  

0


0

Number of households supported through The Production of New Units  

25


28

Number of households supported through Rehab of Existing Units  

6


6

Number of households supported through Acquisition of Existing Units  

60


12

Total 91 46

Granted, a single year is a rather arbitrary term to judge and overall program, given that affordable units might well be coming on line before or after. Such is the case here, the report notes, with the prospect of the Bright Street Co-op. You can read the city’s account of its affordable housing program on Pages 24-26, where the reader is assured that:

“Ensuring the availability of a continuum of housing, for all residents of Burlington, continues to be a top priority for the City.”


Tale of two cities

Consider Burlington times three. That’s Ann Arbor, sort of.

annarbor1

Ann Arbor, like Burlington, has a big student population and a big housing-affordability problem. But now all of a sudden, seemingly, it has something else that Burlington doesn’t: a rental housing glut. Thanks to a profusion of new housing, both on-campus and off, the vacancy rate is up, empty apartments are going begging at the start of another academic year, and some rents are coming down.

Let’s pause here to run the numbers: Ann Arbor’s population is 117,000; the University of Michigan’s enrollment is 43,625, or about 37 percent.

Burlington’s population is about 42,300; UVM’s enrollment is about 12,700, Champlain College’s about 2,000. So, students here comprise around 35 percent.

Ann Arbor’s rents look to be roughly in Burlington’s range. An older, four-bedroom home rents for $2,800, or $700 per bedroom, according to the Ann Arbor News.

Before the surplus in rental housing became apparent, Ann Arbor officials were talking about how to address the affordability problem. The idea of rent control was floated – as it is occasionally in Burlington – but remains impossible without legislative authorization. As things stand, thanks to a 1988 state law, Michigan’s towns and cities can’t do anything to control rent. That means inclusionary zoning is banned, too. Burlington at least has that.

How many of Ann Arbor’s new high-rise rental units are affordable? Probably very few – developers seemingly have no financial incentive to provide any. The good news, for renters, is that some rents are dropping because of all the housing that’s been built (including graduate-student housing by the university). That’s what officials in Burlington like to imagine happening here, too: more student housing plus more private housing development alleviating the upward pressure on rents.

Sounds promising, but Ann Arbor has paid what some might consider an unsightly price: a surfeit of luxury high-rises downtown:

annarbordowntown

The finer points of rent inflation

This may come as a shock, but when it comes to development of multi-family rental housing, new luxury units far outnumber the mid-tier ones across the country. Little wonder, when they’re built on a scale like this:

miamitower

And because of the abundance of luxury units, luxury rentals are rising less rapidly than mid-tier rentals.

So says a recent piece in the Wall Street Journal, which featured this graph on rent inflation that makes the point. Class A is luxury, Class B & C are for middle-income and working-class people:

rentclassgraph

Whether this sort of thing is going on in Vermont is up for discussion. We can’t say for sure. Anecdotally, though, we notice that rents in new mid-tier buildings – never mind the luxury ones – are getting rather pricey.

There’s a new apartment building on South Winooski Avenue in Burlington, for example, where a one bedroom runs $1,350 and a two bedroom, $1,625. Those rates look to be above average, although of course the average is forever rising.

Then there’s a new high-rise complex in Williston where a one bedroom goes for $1,425 and two-bedroom for $1,825.

Both of these places have apartments that are above HUD’s 2015 fair market rents, so they’re off-limits to Section 8 voucher holders.

By the way, HUD’s fair market rents are the same for Burlington, Williston, South Burlington, Winooski, and so on. How do they compare to averages in these places? You be the judge:

1 BR, $1,003; 2 BR, $1,309; 3 BR, $1,639; 4 BR, $1,925.


Spurning another national trend

New population estimates have revealed a startling trend, as described in this blog post on the Harvard Joint Center for Housing Studies website: urban cores growing faster than suburban fringes. Nationally, city populations were up 0.91 percent on average in 2010-14, compared to 0.77 for the suburbs.

“This recent trend of city populations growing faster than those of suburbs is a dramatic departure from prior decades, when suburban population growth significantly outpaced that of cities,” writes Rachel Bogardus Drew, a post-doctoral fellow.

Naturally, this set us to wondering about Vermont’s own megalopolis. Not surprisingly, especially in a state that likes to think of itself as idiosyncratic, the trend doesn’t hold here. If anything, it’s operating in reverse: suburbs here are still outgrowing the urban core of Burlington and Winooski.

chittco

Before getting carried away with this, we remind ourselves that the latest estimates are just that, and the Vermont-scale numbers are so small that errors could easily swing some totals the other way.

Still, we can’t help but notice that the populations of Burlington and Winooski are both down, and those of all the other Chittenden County towns, save Westford, are up:


       2010 census        2009-13 estimate
Bolton town 1182 1204
Buels gore 30 46
Burlington city 42417 42331
Charlotte town 3754 3776
Colchester town 17067 17167
Essex town 19587 19908
Hinesburg town 4396 4427
Huntington town 1938 1965
Jericho town 5009 5021
Milton town 10352 10429
Richmond town 4081 4086
St. George town 674 728
Shelburne town 7144 7332
South Burlington city 17904 18163
Underhill town 3016 3030
Westford town 2029 1947
Williston town 8698 8820
Winooski city 7267 7257


Let’s face it, though, the rises and falls are pretty small, in most cases – further evidence of Vermont’s much-lamented population stagnancy, or graying, as the Millennials flee and the old-timers hang-on. Could it be that some of the Millennials are leaving because they can’t afford to live here?


The renter minority

Yesterday’s post took note of the housing burden borne by Burlington’s renters (they pay 44 percent of their income, on average, on rent/utilities). Demographically, that’s a significant burden, because renters in this city are the majority.

In a state where the home ownership rate is over 70 percent, about 9 points above the national average, not many other municipalities can make that claim. Only one other can, in fact: Winooski.

According to the Vermont Housing Data website, 62.2 percent of Winooski’s residents who live in occupied units are renters. In Burlington, the figure is 57 percent.

burlingtonapt2

These are the only communities in the state where the renter population outnumbers homeowners. The renter-occupant figure for Vermont as a whole is 25.9 percent.

Conscientious readers may recall that Winooski scored No. 1 on the workforce housing index we introduced last month. In case you missed it, that index showed the number of subsidized housing units for every 100 in Vermont’s major employment centers. (We defined major employment centers as municipalities with 2,000 jobs or more in 2014.) Burlington came in at No. 5.

As it happens, several other employment centers that do a relatively good job of providing affordable housing also have big renter populations.

apartment

Barre City’s renter population is 48.5 percent; Rutland City’s, 42.7 percent; Brattleboro’s, 43.2 percent; St. Albans City’s, 46.9 percent; and St. Johnsbury’s, 40 percent.

Of the big suburbs surrounding Burlington/Winooski, South Burlington has the highest renter proportion (30.8 percent). The others are all below the state average: Colchester, 25.8 percent; Essex, 20.6 percent; Shelburne, 17.3 percent; and Williston, 14.9 percent. (All of these communities are “major employment centers,” by the way.)

When people talk about the need for affordable housing in Vermont, they’re talking mostly about multi-family housing for renters (although, yes, efforts to promote accessory rental units, as well as single-family homes/condos for purchase, are important). So, here are a few things to keep in mind about renters in Vermont generally, as compared to homeowners:

  • The median household income for a Vermont renter household ($30,943) is less than half that for the homeowner household ( $64,771).
  • The housing cost burden falls more heavily on renters. Among renters:

— 52.5 percent pay more than 30 percent of their household income on housing, as compared to 32 percent of owners;

–26.4 percent pay more than half their household income on housing, as compared 12 percent of homeowners.


Housing Action Plan revisited

The latest draft of Burlington’s Housing Action Plan, out last week, deserves a few pointed comments. Aside from two additional proposals (bringing the total to 20), there aren’t many substantial changes, but we noticed a few subtle revisions worth noting.

burlingtonapt

We all know there are no simple remedies for the housing affordability problem, which the action plan declares to be one of the city’s “most significant challenges.” The two new proposals certainly don’t qualify as silver bullets.

One is for Burlington to take the lead in “regional housing initiatives that strengthen transportation corridors.” Clustering new housing near transportation nodes or corridors makes sense and is being pushed in various metro areas around the country. Certainly, if any municipality around here is going to take the lead in this sort of planning, it might as well be Burlington. On the other hand, in the absence of county government or targeted oversight by the legislature, regional planning in these parts is largely a hand-waving exercise.

The other new proposal, to improve home energy efficiency of rental units, could help diminish some of the prevailing housing burden (58 percent of Burlingtonians are renters, and they pay an average of 44 percent of their income on housing, the report states), but not the lion’s share of that burden –monthly rents.

The new draft adds language in its first paragraph acknowledging the need to “continue supporting efforts to protect tenants’ rights, prevent displacement, and ensure fair housing” — a commendable revision. Granted, the action plan doesn’t have much to say about fair housing, but that’s OK, because Burlington will be giving fair housing a detailed look in its forthcoming “assessment” mandated by HUD’s affirmatively furthering fair housing regulation.

As before, the plan recommends considering revisions in the inclusionary zoning ordinance. The new draft adds “triggering thresholds” to the provisions to be rethought, but in any case, all the serious rethinking of this ordinance is being deferred to a consultancy-to-be-named later. Ultimately, we’ll be looking for recommendations on how the ordinance can produce affordable units at a higher rate than it has in the past (fewer than 250 units in 25 years).

Another pending review (or moving target) focuses on Plan BTV South End, which we mentioned in a previous post and is in a comment phase now.

Here’s one area where the action plan draft comes up short: addressing the housing burdens of middle-class people, including the proverbial young professionals. The plan’s introduction lays out the affordability “challenge” for “residents across much of the income spectrum, and in particular those who make enough money that they are not eligible for subsidized housing, but struggle to compete in an unhealthy housing market where demand has far outstripped available supply.” What does the plan offer for these residents in particular? Not much, beyond vague references to “workforce housing” and the familiar argument that increasing the housing supply (in part by pulling students out of the rental market and into new residence halls) will ameliorate upward pressure on rents.