Tag Archives: Singapore

Taller & brighter

Once upon a time, believe it or not, planners of public housing in the United States believed high rises were a good thing. In the early ‘40s, we learn from J.A. Stoloff’s history of public housing, the thought high-rises “could provide a healthy, unique living environment that would contrast favorably with surrounding slum areas.”

Well, as we all know, high-rises for families didn’t work too well in the big metro areas. Two notorious examples in Chicago were Cabrini Green …

cabrinigreen


and Robert Taylor Homes…


KONICA MINOLTA DIGITAL CAMERA


drab, unsightly, unlivable in many ways, they unfortunately tainted the popular conception of public housing. No public-housing high-rises were built after the early ‘70s, and by the ‘90s many of these buildings were being torn down.

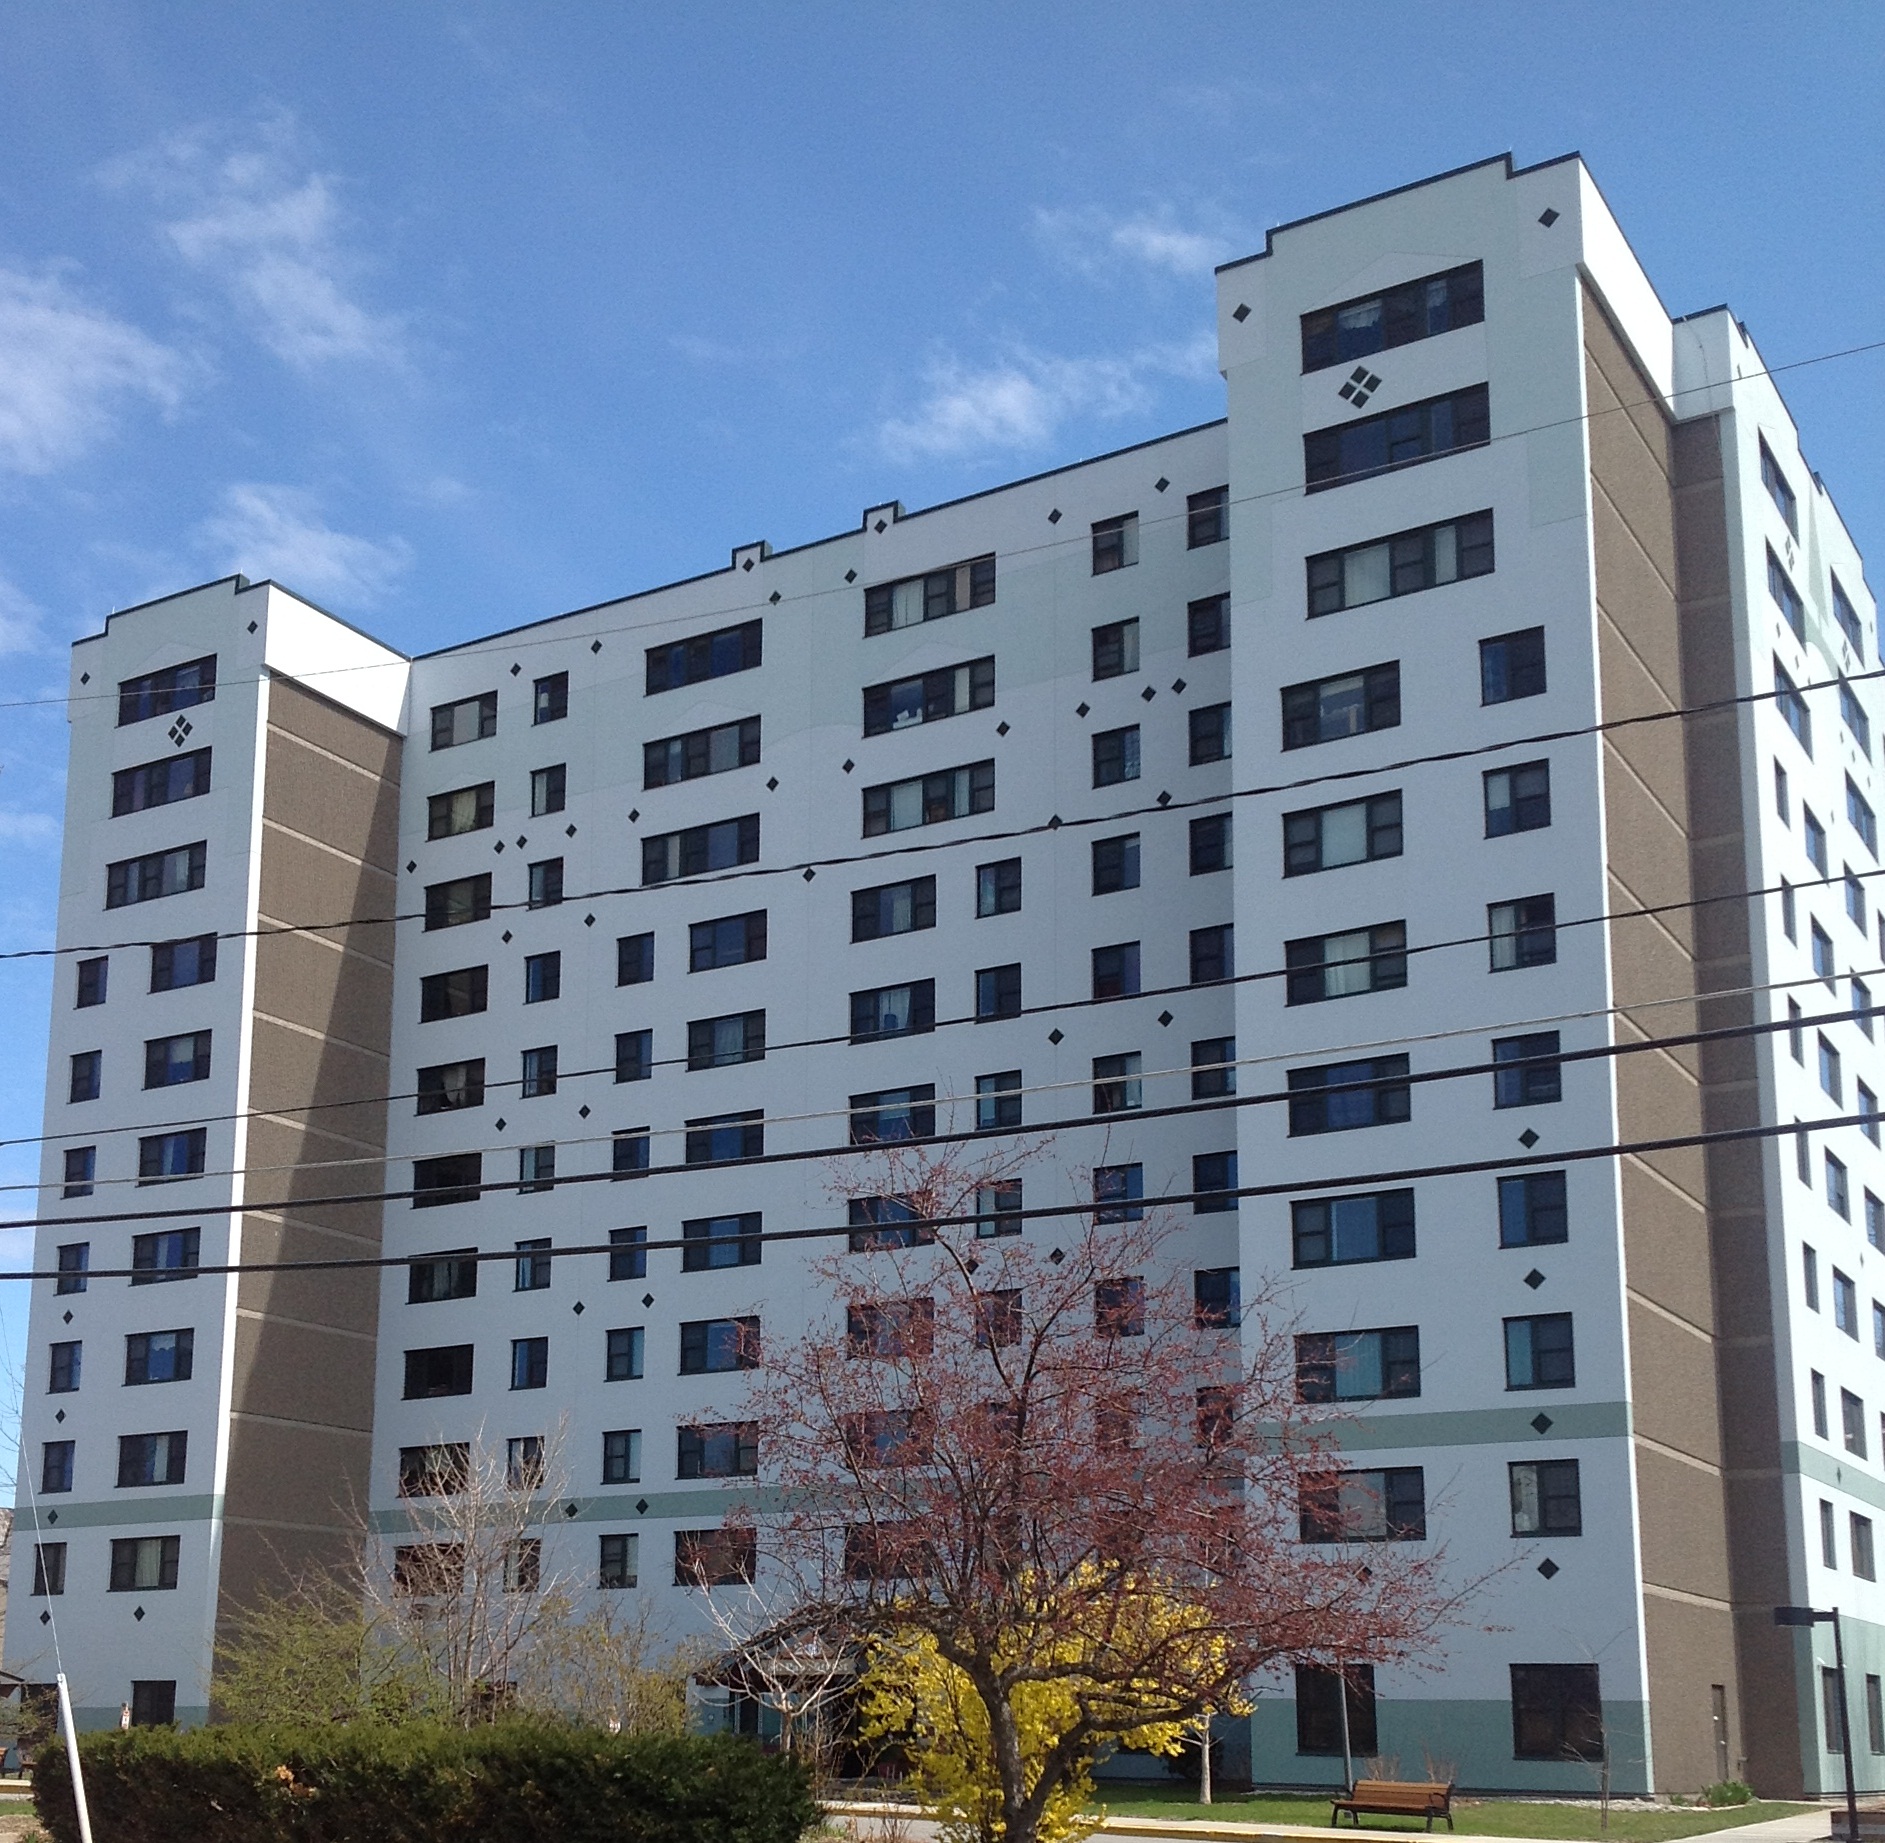
As it turned out, though, some public-housing high-rises did work pretty well – for elderly residents. One such example, built in 1971, is the tallest building in Vermont – 11-story Decker Towers in Burlington, operated by the Burlington Housing Authority for elderly and disabled residents:

decker


Granted, construction of ANY public housing is passe in this country, sadly, but before you stop thinking about high-rises, look at some examples in Singapore, where public-housing high-rises are home to a majority of the population. These shots are by Peter Steinhauer, a photographer:

sing1


These photos make two things really clear: (1) High rises don’t have to be drab and dreary…sing3


sing2


… and (2) no one should have any trouble finding the street address of these places.


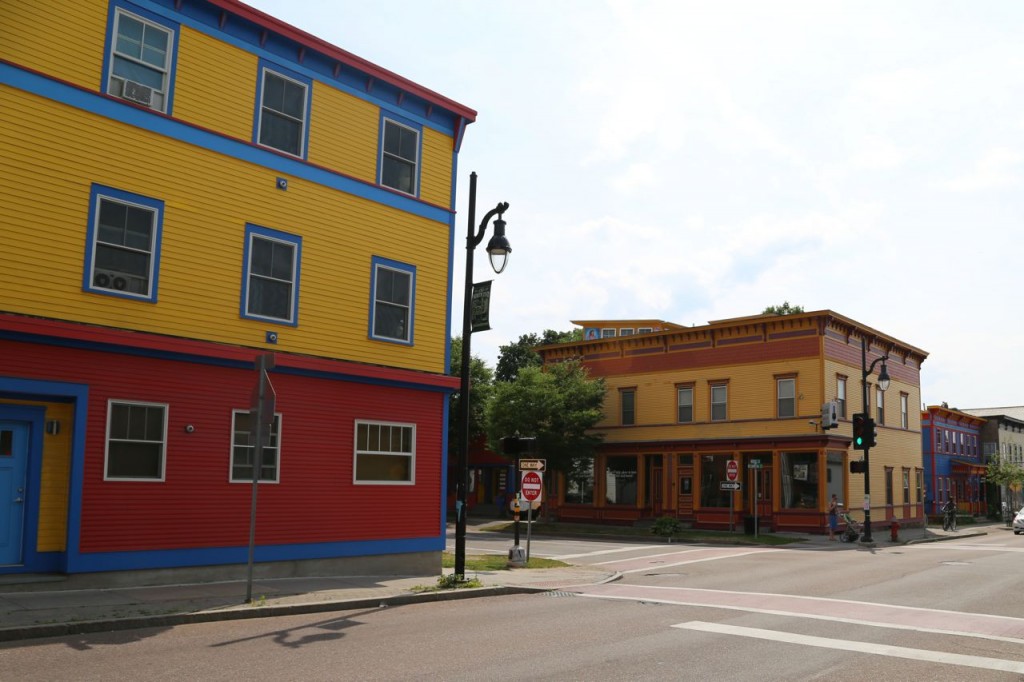
The bright colors bring to mind some of the buildings in Burlington’s Old North End, many of them owned or developed by Stu McGowan …

stu2


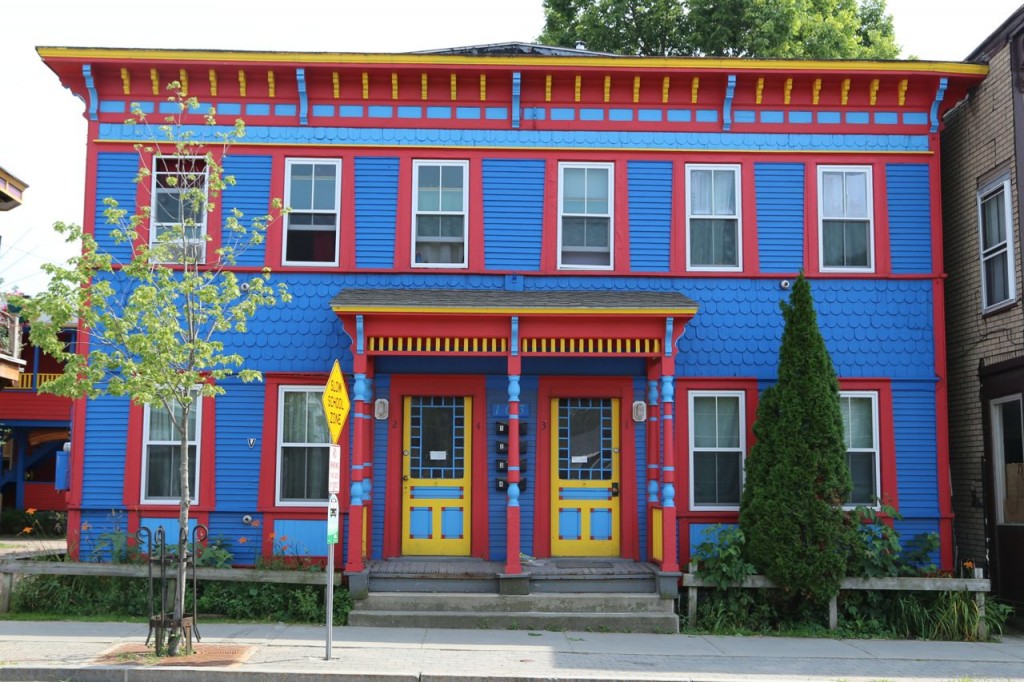
Now that we’ve drawn your attention back to Vermont, let’s consider building height on a Vermont scale as we also consider how to add to the state’s affordable housing stock. High rises are out of the question, of course, especially in our small towns. But what about adding a third story to buildings in town centers, here and there, for family apartments? Is that such an outrageous idea? This three-story building in the photo below doesn’t look a bit out of place.

stu1


And you thought things were bad here!

Now and then it’s nice to get an international perspective even on the most domestic of concerns, like housing. Poking around for comparisons, we stumbled across the “11th Annual Demographia International Housing Affordability Survey: 2015.” This is an interesting document, but rather limited:

  • The domain is restricted to six Anglophone countries,  plus Japan, Singapore and Hong Kong.
  • The “affordability” measure reflects home prices, not rental rates. That measure, the “median multiple,” is the median house price divided by gross annual household income. A median multiple of 3.0 or below is deemed “affordable”; 3.0 to 5.0, “moderately affordable”; and above that, least affordable.”

Anyway, the United States comes off pretty well among this selective international contingent, with an average multiple of 3.4. Canada (3.9), Japan (4.4), Singapore and the U.K. (5.0) are all higher, as are New Zealand (5.2), Australia (5.5) and Hong Kong (17.0). Ireland comes in at most affordable, at 3.0

(Hong Kong’s figure is astounding, but we suspect it’s not uniquely high, world-wide, and we look forward to future surveys that include the likes of Qatar and Luanda, Angola.)

hongkong2

Here’s the survey’s summary of 378 “major markets”:

 Housing Affordability Ratings by Nation: All Markets
 

Nation

Affordable (3.0 &

Under)

Moderately Unaffordable (3.1-4.0) Seriously Unaffordable (4.1-5.0) Severely Unaffordable (5.1 & Over)  

Total


Median Market


Australia 2 1 15 33 51 5.5
Canada 5 16 9 5 35 3.9
China (Hong Kong) 0 0 0 1 1 17.0
Ireland 3 1 1 0 5 3.0
Japan 0 1 1 0 2 4.4
New Zealand 0 0 3 5 8 5.2
Singapore 0 0 1 0 1 5.0
United Kingdom 0 3 14 16 33 5.0
United States 88 97 32 25 242 3.4
TOTAL 98 119 76 85 378 3.8

As usual, major market” data exclude Vermont. Vermont’s “median multiple,” by our rough calculation using numbers from Vermont Housing Data, hovers around 4.0 (3.7, based on adjusted family income, and 4.2 based on household income).

By this measure, we’re considerably less affordable than cities in the western hinterlands:

 Affordable Major Metropolitan Markets
Rank Nation Metropolitan Market Median Multiple
1 U.S. Detroit, MI 2.1
2 U.S. Rochester, NY 2.4
3 U.S. Buffalo, NY 2.6
3 U.S. Cleveland, OH 2.6
5 U.S. Cincinnati, OH-KY-IN 2.7
5 U.S. Grand Rapids, MI 2.7
5 U.S. Pittsburgh, PA 2.7
5 U.S. Saint Louis, MO-IL 2.7
9 U.S. Atlanta, GA 2.9
9 U.S. Indianapolis, IN 2.9
9 U.S. Kansas City, MO-KS 2.9
9 U.S. Louisville, KY-IN 2.9
13 U.S. Columbus, OH 3.0
13 U.S. Oklahoma City, OK 3.0

We do have plenty of license for Schadenfreude, however, when we look at these places:


 10 Least Affordable Major Metropolitan Markets
Rank: Affordability
Least Rank (Out of Median
Affordable 86) Nation Metropolitan Market Multiple
1 86 China Hong Kong 17.0
2 85 Canada Vancouver, BC 10.6
3 84 Australia Sydney, NSW 9.8
4 82 U.S. San Francisco, CA 9.2
4 82 U.S. San Jose, CA 9.2
6 81 Australia Melbourne, VIC 8.7
7 80 U.K. London (GLA) 8.5
8 79 U.S. San Diego, CA 8.3
9 78 N.Z. Auckland 8.2
10 77 U.S. Los Angeles, CA 8.0


According to the survey, the median multiple in most of these countries remained in the manageable 3.0-plus range for many years until rural-to-urban migration ran up against land-use restrictions (“urban containment polices”) that drove up prices and made housing unaffordable for middle-income people as well as the poor. The survey’s authors argue that urban containment policies — “smart growth” would be one example — unduly limit housing development on the urban “fringe.”

Hmmm. Are they saying that sprawl is the price of affordability?