Tag Archives: Winooski

We’re full, so go somewhere else

density1When someone says that a town or a city is “built out,” what does that mean? It often means simply that the speaker doesn’t want any more people moving in – even though it might be possible to design more space, in keeping with local standards, that would accommodate more people.

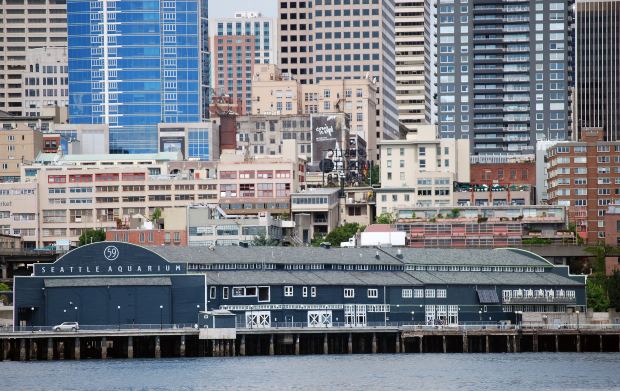
The common claim that a city has run out of room reflects not a physical reality, but rather, an exclusionary prejudice, as Emily Badger suggests in a thought-provoking piece in the Washington Post. She points to widely varying population densities of major “First World” cities (Seattle, 3,000 people per square mile; New York, 4,500; Paris, 9,500; London, 14,600). How can anyone in San Francisco, even with its topographical challenges, argue that that city is “built out” at a mere 5,400 people per square mile? In fact, according a Berkeley economist, the city could accommodate 30-40 percent more people without losing its character.

Building higher and shrinking parking lots can seem reasonable as planning options, but there are limits. In Burlington (2,730 people per square mile), for example, any building higher than about 12 stories would likely be seen as excessive, and no one is ready to enforce a dramatic reduction in vehicles plying the city’s roads. There is such a thing as overcrowding, too (HUD’s so-called Keating memo calls for a limit of two people per bedroom), but of course most American communities are nowhere near their limit.

The most densely populated municipality in Vermont is undoubtedly Winooski , about 4,800 people per square mile.

winooski

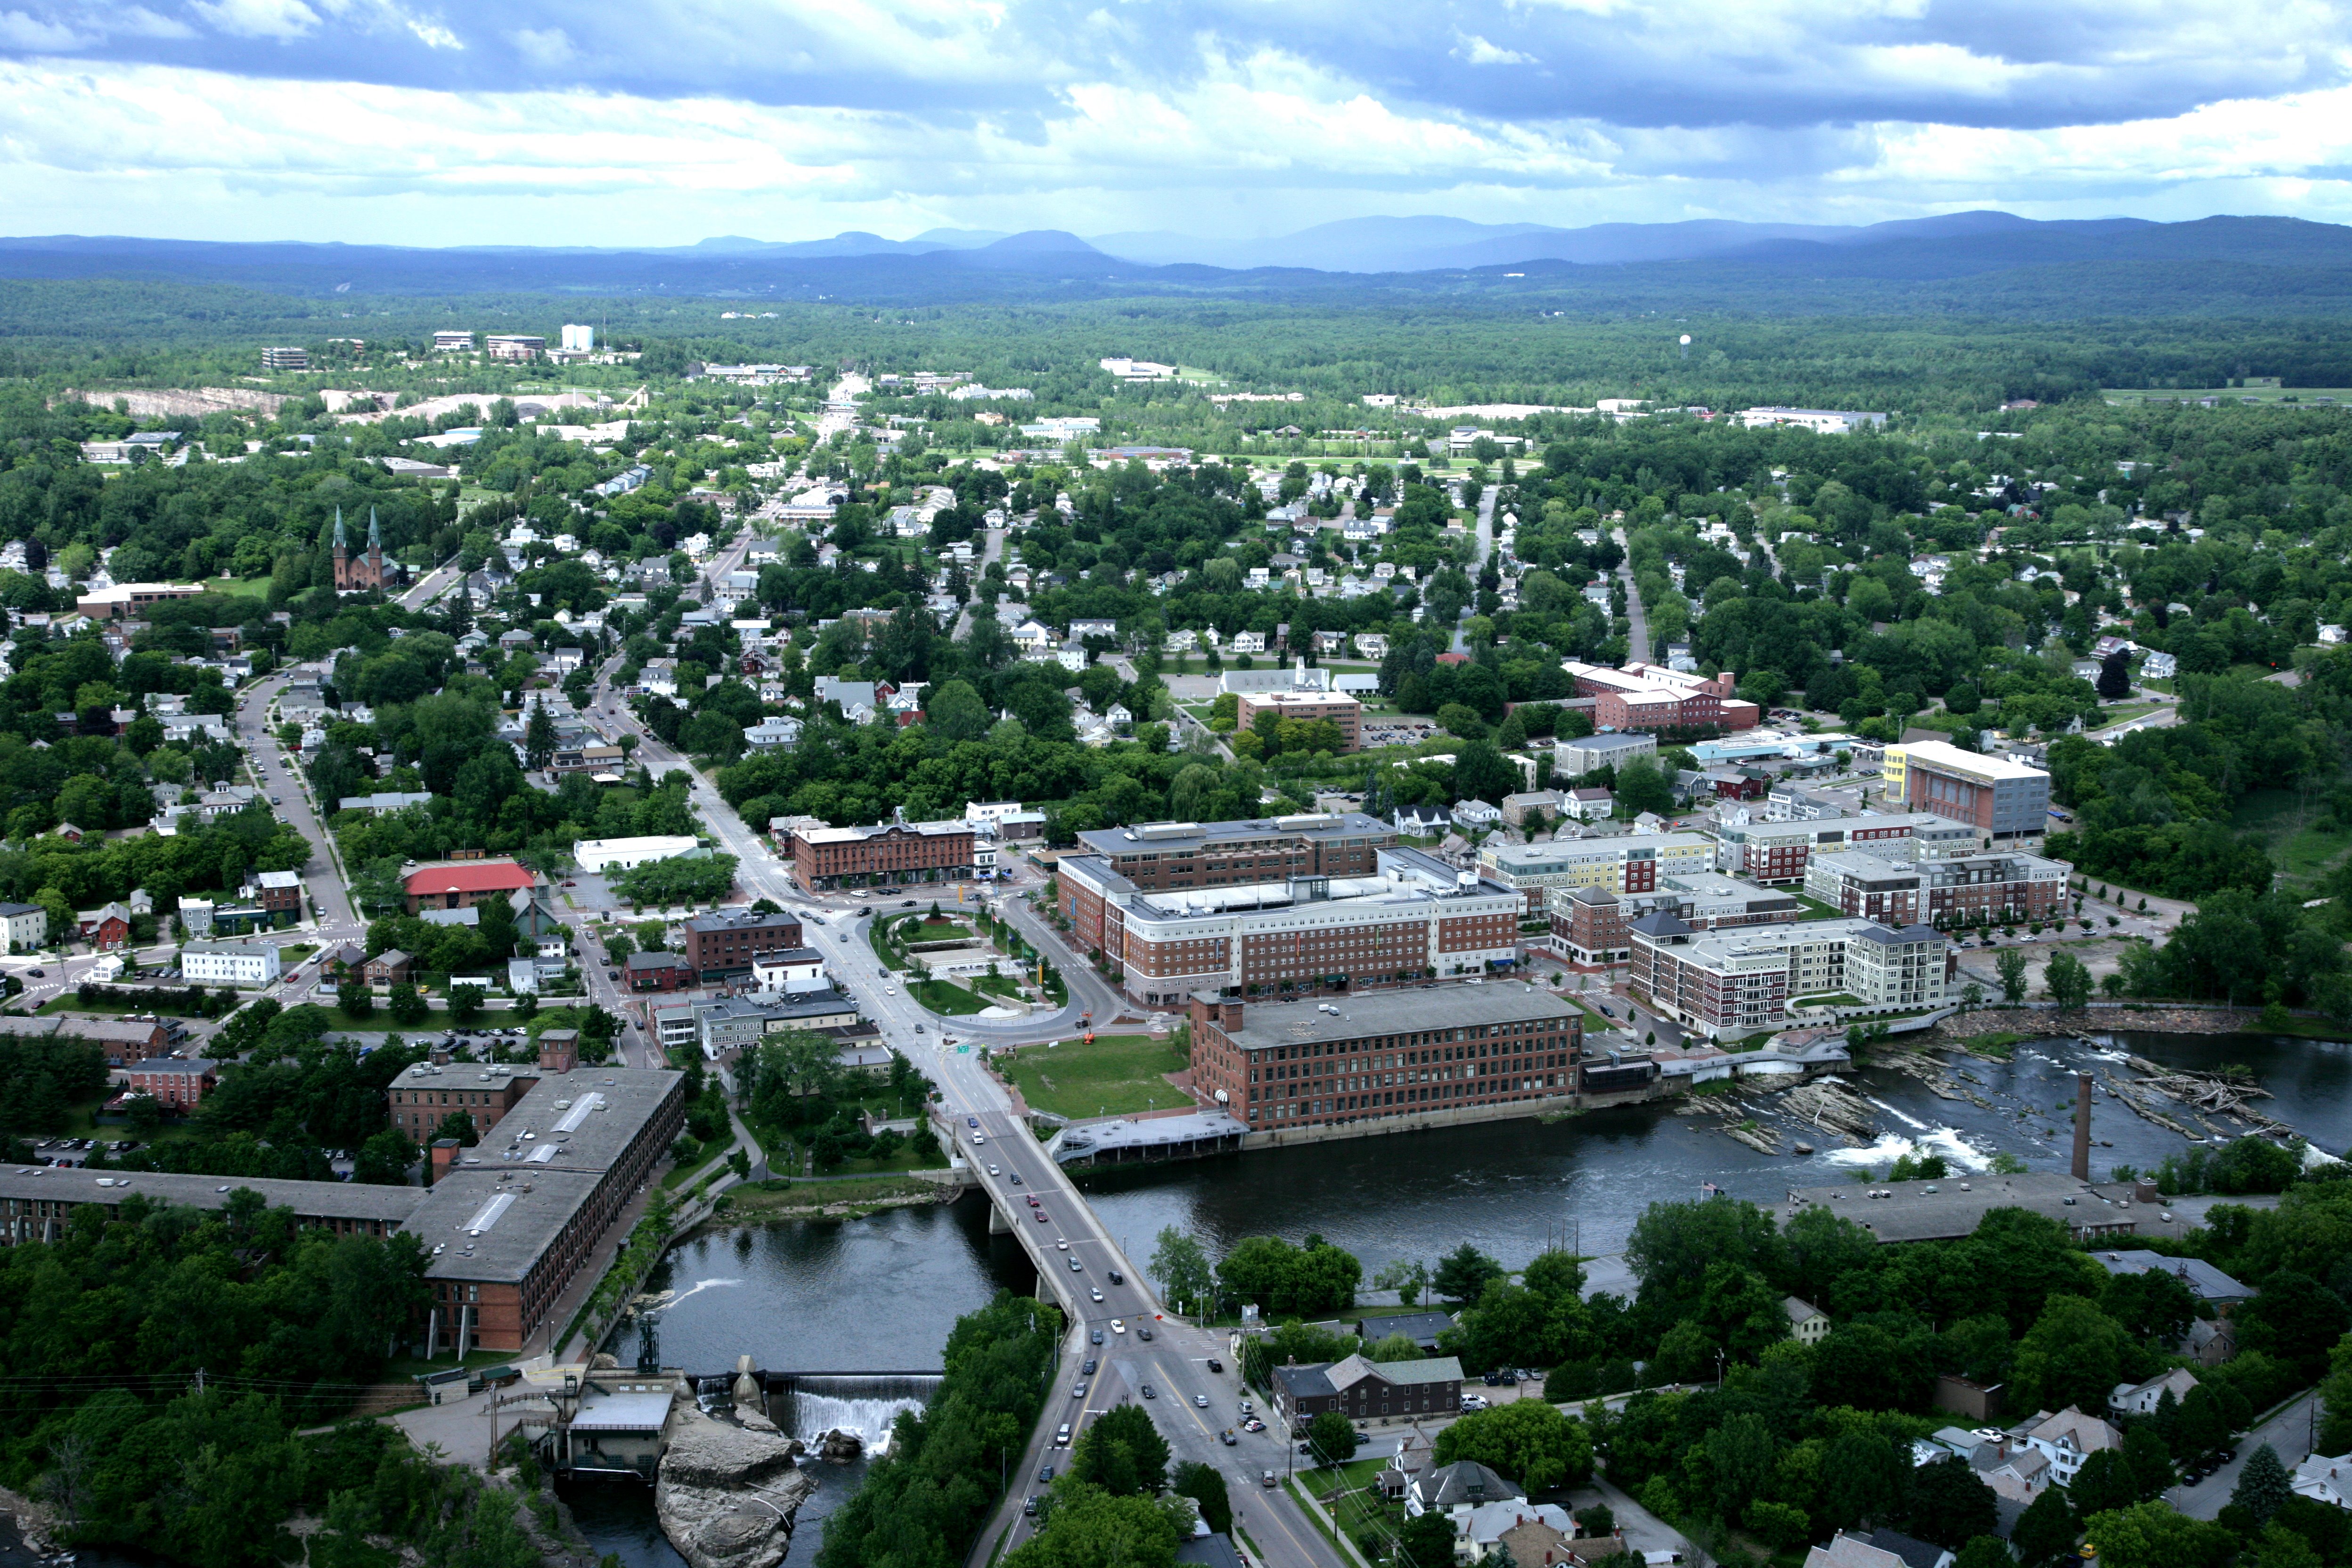
And Winooski, when you meander through it, doesn’t come across as particularly dense – much of its 1.5 square miles is occupied by single-family lots, after all. It could get denser and still be less so than LA (6,000 people per square mile) or Madrid (12,100) – never mind Mexico City (25,100) or Jakarta (24,500).

Nationally, exclusionary land-use practices have had the effect of holding down housing supply and pushing up housing prices. Consider California, where housing prices began to soar above those in the rest of the country starting around 1970. One reason California diverged, according to an legislative analysis that came out earlier this year, is housing construction has been limited – by community resistance, environmental policies and other factors – in coastal urban areas. That has driven up prices there and inland as well.

The legislative analyst called for policy changes that would lead to significantly more housing along the coast. Here again, the suggested remedy for unaffordability was a familiar one: increase the housing supply. But does anyone believe that can be left simply to market forces?

Moreover, merely eliminating exclusionary policies and increasing density, while favoring more affordability, aren’t necessarily sufficient to promote inclusiveness, or integration. The pro-density strategy has to be combined with affirmatively fair housing, as Jamaal Green argues in this Shelterforce article.


Spurning another national trend

New population estimates have revealed a startling trend, as described in this blog post on the Harvard Joint Center for Housing Studies website: urban cores growing faster than suburban fringes. Nationally, city populations were up 0.91 percent on average in 2010-14, compared to 0.77 for the suburbs.

“This recent trend of city populations growing faster than those of suburbs is a dramatic departure from prior decades, when suburban population growth significantly outpaced that of cities,” writes Rachel Bogardus Drew, a post-doctoral fellow.

Naturally, this set us to wondering about Vermont’s own megalopolis. Not surprisingly, especially in a state that likes to think of itself as idiosyncratic, the trend doesn’t hold here. If anything, it’s operating in reverse: suburbs here are still outgrowing the urban core of Burlington and Winooski.

chittco

Before getting carried away with this, we remind ourselves that the latest estimates are just that, and the Vermont-scale numbers are so small that errors could easily swing some totals the other way.

Still, we can’t help but notice that the populations of Burlington and Winooski are both down, and those of all the other Chittenden County towns, save Westford, are up:


       2010 census        2009-13 estimate
Bolton town 1182 1204
Buels gore 30 46
Burlington city 42417 42331
Charlotte town 3754 3776
Colchester town 17067 17167
Essex town 19587 19908
Hinesburg town 4396 4427
Huntington town 1938 1965
Jericho town 5009 5021
Milton town 10352 10429
Richmond town 4081 4086
St. George town 674 728
Shelburne town 7144 7332
South Burlington city 17904 18163
Underhill town 3016 3030
Westford town 2029 1947
Williston town 8698 8820
Winooski city 7267 7257


Let’s face it, though, the rises and falls are pretty small, in most cases – further evidence of Vermont’s much-lamented population stagnancy, or graying, as the Millennials flee and the old-timers hang-on. Could it be that some of the Millennials are leaving because they can’t afford to live here?


The renter minority

Yesterday’s post took note of the housing burden borne by Burlington’s renters (they pay 44 percent of their income, on average, on rent/utilities). Demographically, that’s a significant burden, because renters in this city are the majority.

In a state where the home ownership rate is over 70 percent, about 9 points above the national average, not many other municipalities can make that claim. Only one other can, in fact: Winooski.

According to the Vermont Housing Data website, 62.2 percent of Winooski’s residents who live in occupied units are renters. In Burlington, the figure is 57 percent.

burlingtonapt2

These are the only communities in the state where the renter population outnumbers homeowners. The renter-occupant figure for Vermont as a whole is 25.9 percent.

Conscientious readers may recall that Winooski scored No. 1 on the workforce housing index we introduced last month. In case you missed it, that index showed the number of subsidized housing units for every 100 in Vermont’s major employment centers. (We defined major employment centers as municipalities with 2,000 jobs or more in 2014.) Burlington came in at No. 5.

As it happens, several other employment centers that do a relatively good job of providing affordable housing also have big renter populations.

apartment

Barre City’s renter population is 48.5 percent; Rutland City’s, 42.7 percent; Brattleboro’s, 43.2 percent; St. Albans City’s, 46.9 percent; and St. Johnsbury’s, 40 percent.

Of the big suburbs surrounding Burlington/Winooski, South Burlington has the highest renter proportion (30.8 percent). The others are all below the state average: Colchester, 25.8 percent; Essex, 20.6 percent; Shelburne, 17.3 percent; and Williston, 14.9 percent. (All of these communities are “major employment centers,” by the way.)

When people talk about the need for affordable housing in Vermont, they’re talking mostly about multi-family housing for renters (although, yes, efforts to promote accessory rental units, as well as single-family homes/condos for purchase, are important). So, here are a few things to keep in mind about renters in Vermont generally, as compared to homeowners:

  • The median household income for a Vermont renter household ($30,943) is less than half that for the homeowner household ( $64,771).
  • The housing cost burden falls more heavily on renters. Among renters:

— 52.5 percent pay more than 30 percent of their household income on housing, as compared to 32 percent of owners;

–26.4 percent pay more than half their household income on housing, as compared 12 percent of homeowners.


Jobs and affordable housing, Part 1


“Workforce housing” has become a popular term among housing advocates. Its definition varies, but for our purposes, it simply means affordable housing that’s fairly close to the workplaces of lower-and middle-income people.

Now, the ideal is that all the people who make a town’s economy run — the cashiers and the teachers, the home health-care aides and the police officers, the waitresses and the accountants, the secretaries and the tradespeople, from carpenters and plumbers to electricians — should all be able to live in town, if they want. That’s a form of population diversity — in skill sets, in housing options — that the Fair Housing Project wants to encourage: affordable housing for people of mixed incomes near their work sites.

winooski

Well then, one might well wonder how the job locations and the affordable housing units in Vermont match up … or don’t, town by town.

There’s no easy way to get at this, but here’s a proxy approach:

Look at municipalities that are employment centers and see how many units of subsidized housing they have.

Of course, “subsidized housing” typically refers to housing for people earning up to 80 percent of the median income, so it’s not the same as housing that accommodates a wide-ranging workforce of middle and above average incomes. But at least we can get an idea of which employment centers are more or less accommodating of lower-paid workers — the cashiers and personal care aides, for example, the two occupations with the most numerous openings in Vermont, according to the Department of Labor. We’ll assume that full-time cashiers and personal care aides qualify for subsidized housing. (Cashiers’ median hourly wage in Vermont last year was $9.73; personal care aides’, $10.99. By contrast, Vermont’s “housing wage” — the hourly rate needed to afford an average apartment without paying more than 30 percent of income– was $19.36.)

As for “employment centers” there were more than 80 Vermont municipalities that offered 500 jobs or more in 2014, according to Department of Labor statistics.

Of those, more than 30 had 2,000 jobs or more. Arbitrarily, we’ll call those the “major employment centers.”

To find out how many subsidized housing units each municipality has, we simply go to the Directory of Affordable Housing on the Housing Data website , pull up all the site-specific units for each town, and add them up.

With these two figures for each municipality — number of jobs and number of subsidized (affordable) housing units — we can derive a seat-of-the-pants workforce housing index: How many subsidized units for each 100 jobs. The higher the index, the more “workforce housing” that community provides.

Well, it turns out that all but one of Vermont’s major employment centers have a workforce housing index under 10 – that is, they each have fewer than 10 affordable housing units for every 100 workers.

The exception is Winooski, where the index is a whopping 24. (The city occupies a mere square mile, much of which is included in the aerial photo above.) Winooski had 2,799 jobs in 2014 and 687 subsidized housing units — the friendliest affordability ratio in Vermont by far.

Which major employment centers in Vermont had the fewest subsidized units? Stay tuned.