To your library of testimonials on the growing income inequality, you can add this one from the Urban Institute, a study titled “Worlds Apart: Inequality between America’s Most and Least Affluent Neighborhoods,” that shows disparities increasing from 1990 to 2010. This paper uses a composite index (income, educational attainment, home ownership rates, median house value) to identify neighborhoods in the top 10 percent and bottom 10 percent.
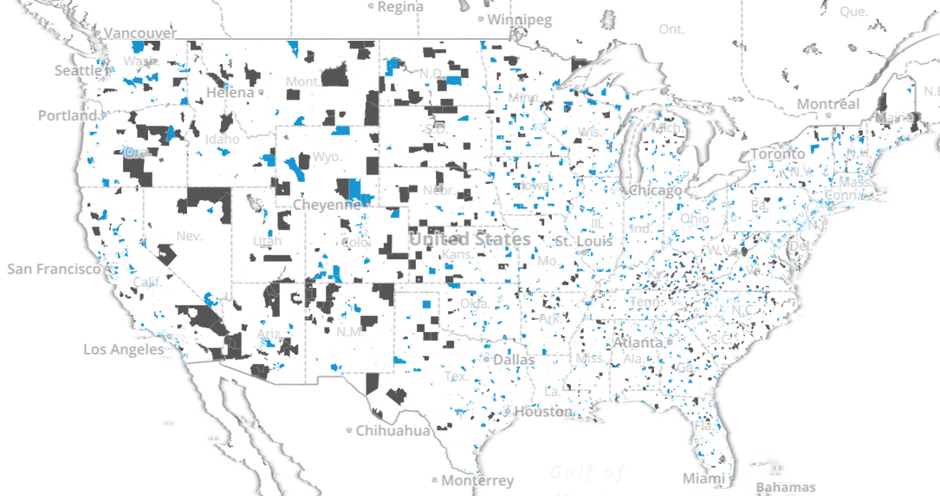
You can see them plotted on an interactive national map. Here’s 2010 (blue is “top,” grey “bottom”):
If you scroll to the Northeast you can check out Vermont’s evolution – interesting, but not particularly dramatic.
As is the case with most such national surveys that focus on metropolitan areas, this one analyzes “commuting zones.” In Vermont’s case, that’s a designation of questionable applicability, because it means a zone centered on Burlington with a population of 321,946, more than half the state’s total.
In an appendix, the study lists dozens of commuting zones, each with its “inequality index,” and Burlington comes out OK – somewhere in the middle. Ditto Burlington’s growth of income disparity over 20 years.
Although there has been some shifting of the top and bottom zones across the country, the wealthy zones have remained fairly impregnable. One reason for that, as this analysis of the Urban Institute data emphasizes, is that discriminatory housing policies, such as exclusionary zoning (e.g., large lot sizes) that preserve richer residential enclaves. Multi-family rental housing, affordable or not, is typically missing from these neighborhoods altogether.
Of course, discriminatory land use policies aren’t the sole culprit. High land prices are an obvious deterrent for affordable housing development. Then again, discriminatory policies in many cases may have contributed to the higher prices … a vicious circle.