Category Archives: renters

Burlington’s unaffordability update

Yesterday was the due date for Burlington’s CAPER – that is, the Consolidated Annual Performance & Evaluation Report that the city has to file with HUD every year as a condition of receiving Community Development Block Grant (CDBG) and HOME funds. (HOME is a federal program that supports the rehabilitation, acquisition and construction of rental housing.)

burlingtonapt

If you want to know more about the allocation of these funds, which amount to several million dollars, and about the beneficiaries, you can go to the report, which covers July 1, 2014 to June 30 , 2015. Here, we’re just going to refer to  three graphics that apply to housing.

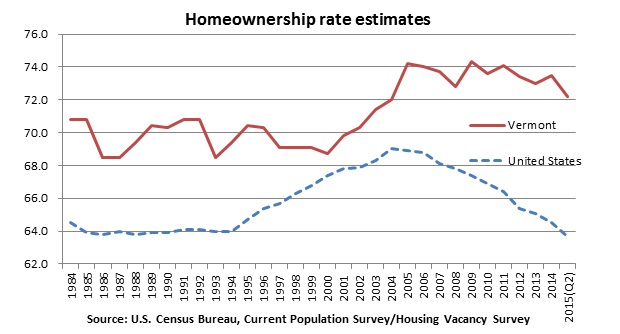
The first two may look familiar to you. They’re in Appendix A, Pages 53 and 54. Rental vacancy rates in Chittenden County have been exceedingly low for at least two decades, as shown on the first graph, and still are. That’s one reason rents are as high as they are.

The vacancy rate here here is typically below 2 percent. That’s below  the “Balanced rate” of 4 percent supposedly the threshold for a healthy rental market, and its well below the rates for the Northeast and the U.S.

As for the housing wage – that is, the amount a person has to earn to be able to afford to rent an dwelling of average cost — well, no big surprises here, either. The graph on Page 25 shows four pillars, left to right, represent the costs of renting apartments: efficiency, one-bedroom, two-bedroom and three-bedroom. As you can see, a minimum-wage worker is out of luck, as is a median-wage worker who wants anything bigger than an efficiency.

By definition, you can “afford” an apartment if you spend no more than 30 percent of your income on housing. For context: According to the 2015 edition of “Out of Reach,” put out by the National Low Income Housing Coalition, Vermont’s two-bedroom-apartment housing wage is $20.68 an hour, and the average wage for renters is $11.78.

OK, so how did Burlington fare for the year in its affordable housing program? It came up short, as you can see in the following table:

CR-20 – Affordable Housing 91.520(b)

Evaluation of the jurisdiction’s progress in providing affordable housing, including the number and types of families served, the number of extremely low-income, low-income, moderate-income, and middle-income persons served.


  One-Year Goal Actual
Number of Homeless households to be provided affordable housing units  

15


0

Number of Non-Homeless households to be provided affordable housing units  

76


46

Number of Special-Needs households to be provided affordable housing units  

0


0

Total 91 46


  One-Year Goal Actual
Number of households supported through Rental Assistance  

0


0

Number of households supported through The Production of New Units  

25


28

Number of households supported through Rehab of Existing Units  

6


6

Number of households supported through Acquisition of Existing Units  

60


12

Total 91 46

Granted, a single year is a rather arbitrary term to judge and overall program, given that affordable units might well be coming on line before or after. Such is the case here, the report notes, with the prospect of the Bright Street Co-op. You can read the city’s account of its affordable housing program on Pages 24-26, where the reader is assured that:

“Ensuring the availability of a continuum of housing, for all residents of Burlington, continues to be a top priority for the City.”


Plotting neighborhoods, top and bottom

To your library of testimonials on the growing income inequality, you can add this one from the Urban Institute, a study titled “Worlds Apart: Inequality between America’s Most and Least Affluent Neighborhoods,” that shows disparities increasing from 1990 to 2010. This paper uses a composite index (income, educational attainment, home ownership rates, median house value) to identify neighborhoods in the top 10 percent and bottom 10 percent.

You can see them plotted on an interactive national map. Here’s 2010  (blue is “top,” grey “bottom”):

citylab

If you scroll to the Northeast you can check out Vermont’s evolution – interesting, but not particularly dramatic.

As is the case with most such national surveys that focus on metropolitan areas, this one analyzes “commuting zones.” In Vermont’s case, that’s a designation of questionable applicability, because it means a zone centered on Burlington with a population of 321,946, more than half the state’s total.

In an appendix, the study lists dozens of commuting zones, each with its “inequality index,” and Burlington comes out OK – somewhere in the middle. Ditto Burlington’s growth of income disparity over 20 years.

Although there has been some shifting of the top and bottom zones across the country, the wealthy zones have remained fairly impregnable. One reason for that, as this analysis of the Urban Institute data emphasizes, is that discriminatory housing policies, such as exclusionary zoning (e.g., large lot sizes) that preserve richer residential enclaves. Multi-family rental housing, affordable or not, is typically missing from these neighborhoods altogether.

Of course, discriminatory land use policies aren’t the sole culprit. High land prices are an obvious deterrent for affordable housing development. Then again, discriminatory policies in many cases may have contributed to the higher prices … a vicious circle.


New population bulge: renters

Renters — and the cost burdens associated with renting — are on the rise across the country. Two recent studies say so, so we might as well cite them here. One, by Enterprise Community Partners and Harvard’s Joint Center for Housing Studies, projects that renter households will increase by 4.2 million over the next 10 years. Another, by the Urban Institute, puts that number at 6 million. And the share of rental households that’s “severely cost-burdened” – that is, paying 50 percent of income or more for housing – will go up 11 to 25 percent under various economic scenarios, says the former study.

apartment2

Meanwhile, says the Urban Institute, the home ownership rate will go down for all but the oldest population segment. The explanations of these and other stark housing projects are familiar – among them, that college-debt-burdened Millennials aren’t moving into the house-buying market the way their age group did a generation or two ago.

Here we inject the good news/bad news for Vermont.

The home ownership rate here is above the national average and has not mirrored the national drop over the last few years.

vthomeownership

Rental cost-burden rates here are, however, about at the national average: 26 percent of Vermont’s renters are “severely cost burdened,” according to Vermont Housing Data.

If the renter population swells in Vermont, how likely is it that the number of affordable housing units keeps pace? Not very, without some form of government intervention. Here’s what the Enterprise/Harvard study says about that:

“The need for affordable housing is already overwhelming the capacity of federal, state and local governments to supply assistance. At last measure, 11.2 million extremely low-income households competed for 7.3 million units affordable to them – a 3.9 million unit shortfall. And with 7.7 million unassisted very low-income renters with worst case housing needs in 2013 as defined by U.S. Department of Housing and Urban Development (HUD), only just over a quarter (26 percent) of eligible very low-income households received rental assistance.”

Now, some might argue that if private developers are simply turned loose to produce a flood of new housing, affordability will take care of itself.

That’s not likely, either. Check out the state of affairs in Portland, Ore.,  a place that has experienced both a building boom and an unaffordability boom, and where the mayor just declared a “state of emergency for housing and homelessness.”